Computation speed benchmark
Scope
This notebook is an environment-specific engineering benchmark. It helps estimate how statevector dimension affects the current local backend. Absolute timings should be compared only when the recorded machine and software environment are similar.
The benchmark measures mean execution time for several model operations and dimensions under the recorded environment.
import multiprocessing
import os
import platform
import re
import subprocess
import time

import matplotlib.pyplot as plt
import numpy as np
import pandas as pd
from IPython.display import HTML, display
Local machine details
Log the local machine details on which the test is carried out:
def get_cpu_model(spec="model name"):
    if platform.system() == "Windows":
        return platform.processor()
    if platform.system() == "Darwin":
        try:
            return subprocess.check_output(
                ["sysctl", "-n", "machdep.cpu.brand_string"], text=True
            ).strip()
        except OSError, subprocess.CalledProcessError:
            return platform.processor() or platform.machine()
    if platform.system() == "Linux":
        command = "cat /proc/cpuinfo"
        stream = os.popen(command)
        all_info = stream.read()
        all_info.strip()
        all_info = all_info.split("\n")
        # all_info = str(subprocess.check_output(command, shell=True).strip())
        for line in all_info:
            if spec in line:
                return re.sub(f".*{spec}.*: ", "", line, 1)
def get_specs():
    table = [
        # ["", platform.version()],
        ["Machine", platform.machine()],
        ["Platform", platform.platform()],
        ["Architecture", platform.architecture()],
        ["Cores", get_cpu_model("model name")],
        ["Number of cores", multiprocessing.cpu_count()],
        ["Python version", platform.python_version()],
    ]
    dataframe = pd.DataFrame(table, columns=["Spec", "Value"])
    display(HTML(dataframe.to_html(index=False)))
get_specs()
/tmp/ipykernel_1118/3135866240.py:20: DeprecationWarning: 'count' is passed as positional argument
  return re.sub(f".*{spec}.*: ", "", line, 1)
| Spec | Value |
|---|---|
| Machine | x86_64 |
| Platform | Linux-7.0.0-1004-aws-x86_64-with-glibc2.35 |
| Architecture | (64bit, ) |
| Cores | AMD EPYC 7R13 Processor |
| Number of cores | 2 |
| Python version | 3.14.6 |
Test function
Create a test function to test the models:
def test_model(Model, n):

    init_time = list()
    encode_time = list()
    decode_time = list()
    total_time = list()

    # Iterations for computing mean and standard deviation
    iterations = 50

    for i in range(1, iterations + 1):
        # Initialization
        start_process = time.time()
        model = Model(n, 1)
        # Encoding
        start_encode = time.time()
        for dim in range(model.n):
            model.encode(0.5, dim)
        # Decoding
        start_decode = time.time()
        result = model.decode()
        end_process = time.time()

        # Store timings
        init_time.append(start_encode - start_process)
        encode_time.append(start_decode - start_encode)
        decode_time.append(end_process - start_decode)
        total_time.append(end_process - start_process)

    return [
        n,
        np.mean(init_time),
        np.mean(encode_time),
        np.mean(decode_time),
        np.mean(total_time),
        np.std(total_time),
    ]
def plot_results(df, title="Model"):
    """Plot all the results"""

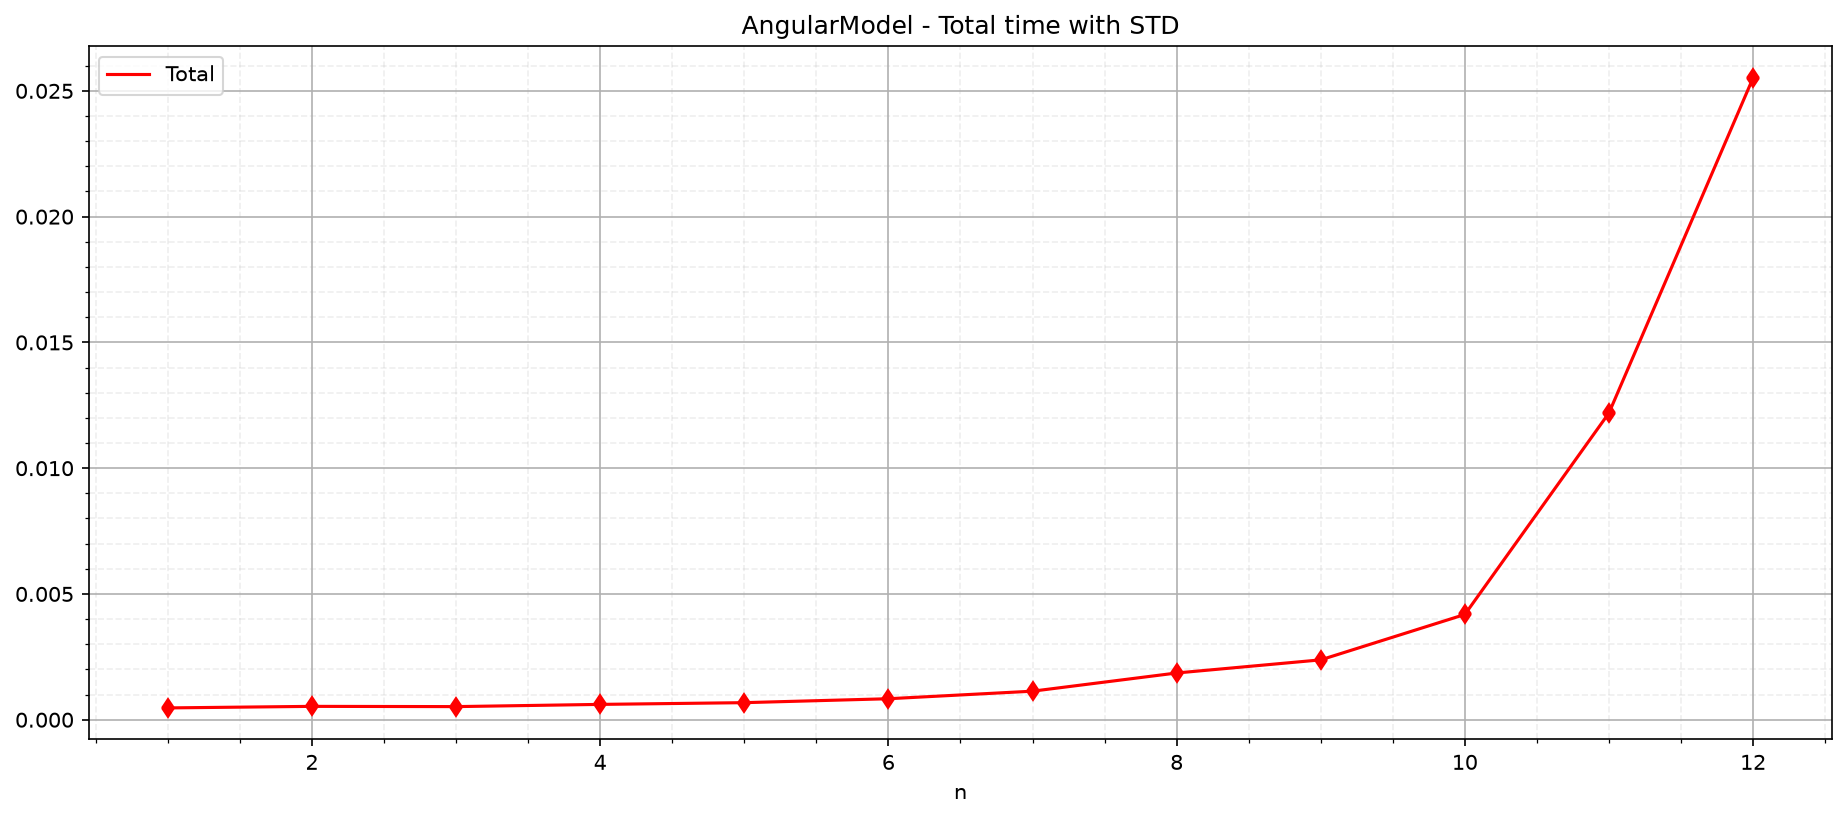
    # Total timewith STD
    fig = plt.figure(figsize=(15, 6), dpi=150)

    df.plot(
        x="n",
        y=[4],
        yerr="Total STD",
        uplims=True,
        lolims=True,
        kind="line",
        color="r",
        ax=plt.gca(),
    )
    plt.title(f"{title} - Total time with STD")

    plt.grid(visible=True, which="major", linestyle="-")
    plt.grid(visible=True, which="minor", linestyle="--", alpha=0.2)
    plt.minorticks_on()

    plt.show()

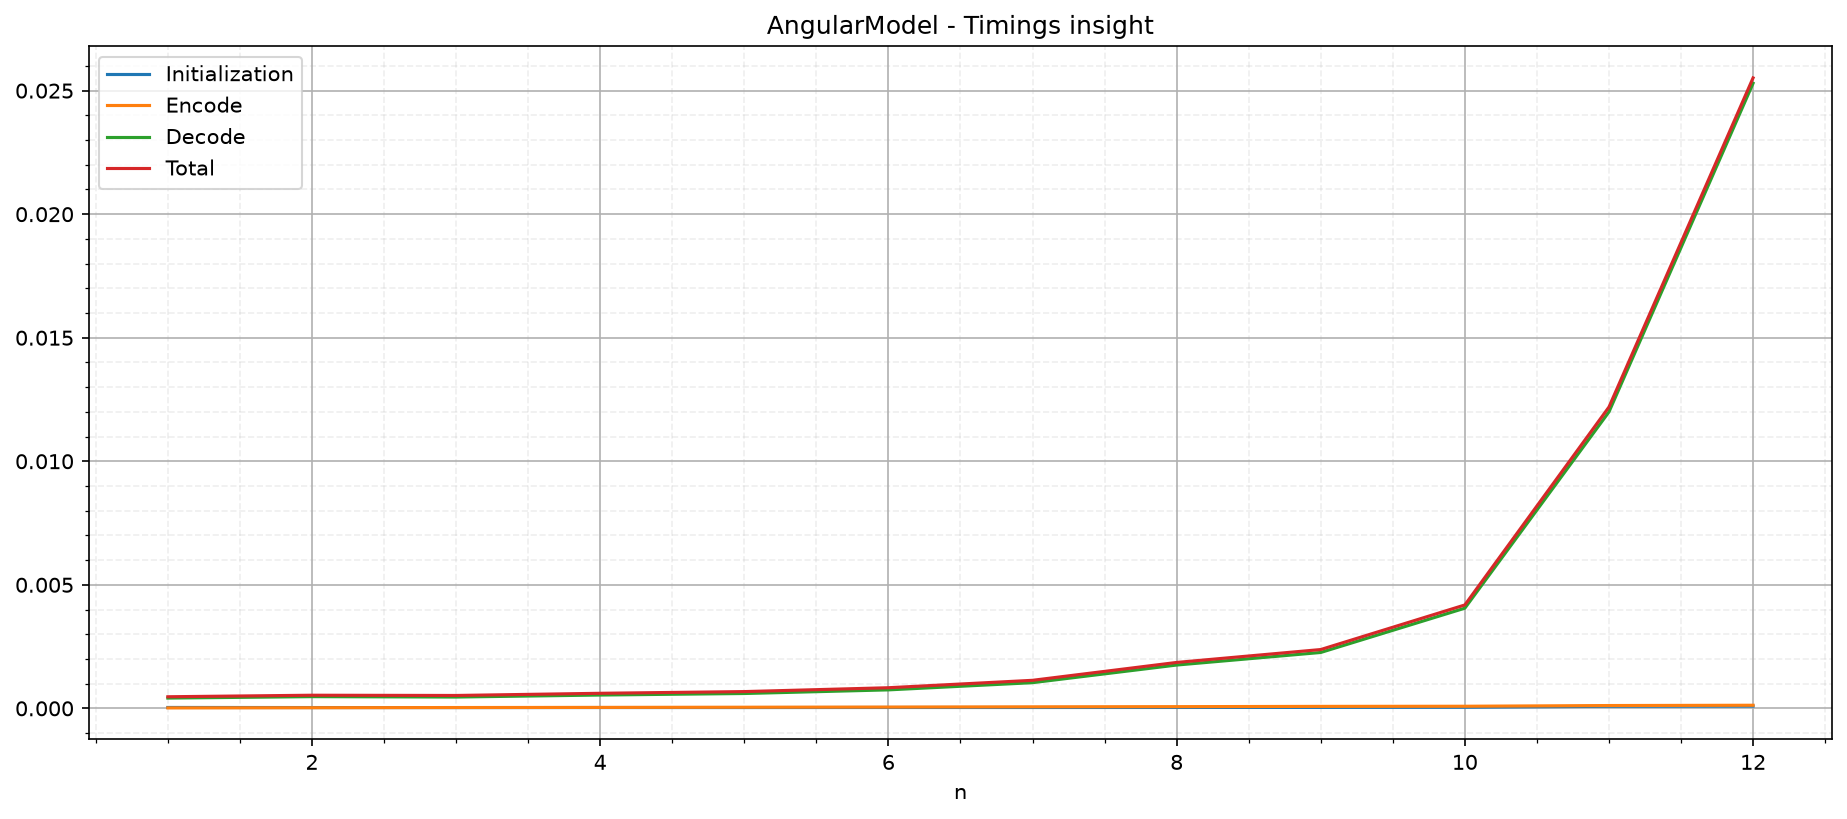
    # Timings insight
    fig = plt.figure(figsize=(15, 6), dpi=150)

    df.plot(x="n", y=[1, 2, 3, 4], kind="line", ax=plt.gca())
    plt.title(f"{title} - Timings insight")

    plt.grid(visible=True, which="major", linestyle="-")
    plt.grid(visible=True, which="minor", linestyle="--", alpha=0.2)
    plt.minorticks_on()

    plt.show()

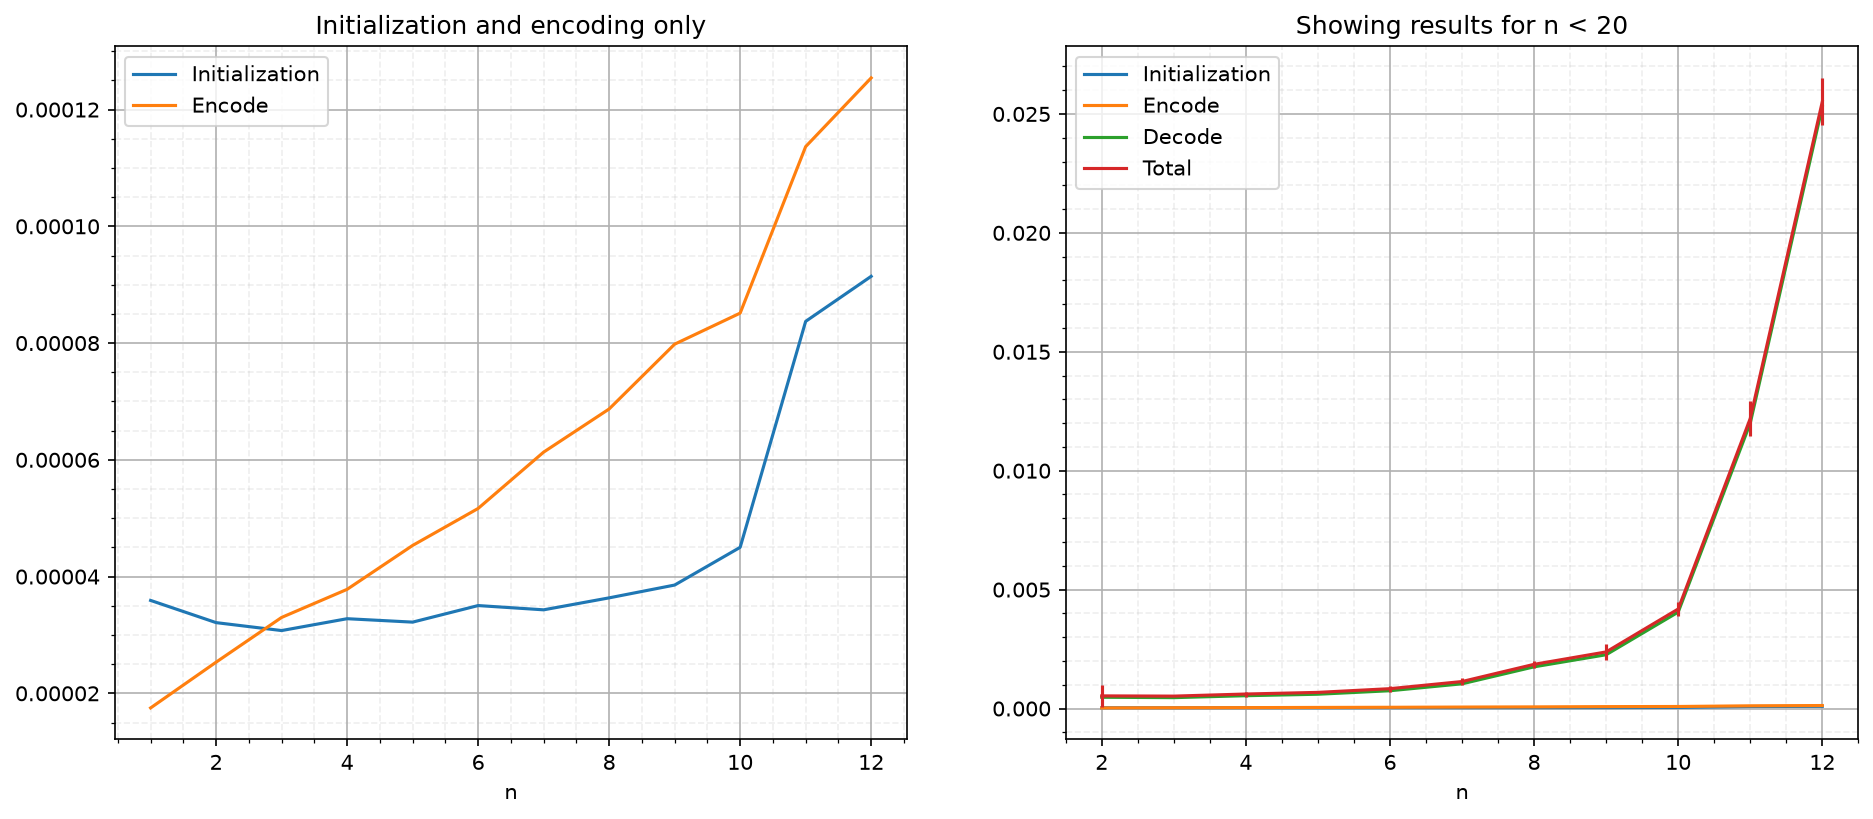
    # Zooming in
    print("Zooming in:")
    fig = plt.figure(figsize=(15, 6), dpi=150)

    df.plot(x="n", y=[1, 2], kind="line", ax=plt.subplot(1, 2, 1))
    plt.title("Initialization and encoding only")

    plt.grid(visible=True, which="major", linestyle="-")
    plt.grid(visible=True, which="minor", linestyle="--", alpha=0.2)
    plt.minorticks_on()

    ax = plt.subplot(1, 2, 2)
    df[1:19].plot(x="n", y=[1, 2, 3], kind="line", ax=ax)
    df[1:19].plot(x="n", y=[4], yerr="Total STD", kind="line", ax=ax)
    plt.title("Showing results for n < 20")

    plt.grid(visible=True, which="major", linestyle="-")
    plt.grid(visible=True, which="minor", linestyle="--", alpha=0.2)
    plt.minorticks_on()

    plt.show()
AngularModel
We test initialization, encoding, and decoding for an input of .5 on each dimension. The executable documentation caps the statevector benchmark at 12 qubits so it remains practical on documentation builders.
from qrobot.models import AngularModel

max_n = 12
table = list()

for n in range(1, max_n + 1):
    print(f"Testing n={n}", end="\r")
    table.append(test_model(AngularModel, n))
print("             ")

df_angular = pd.DataFrame(
    table, columns=["n", "Initialization", "Encode", "Decode", "Total", "Total STD"]
)
Testing n=1
Testing n=2
Testing n=3
Testing n=4
Testing n=5
Testing n=6
Testing n=7
Testing n=8
Testing n=9
Testing n=10
Testing n=11
Testing n=12
Plotting the results:
plot_results(df_angular, "AngularModel")
Zooming in:
Numerical values:
df_angular
| n | Initialization | Encode | Decode | Total | Total STD | |
|---|---|---|---|---|---|---|
| 0 | 1 | 0.000036 | 0.000017 | 0.000416 | 0.000469 | 0.000095 |
| 1 | 2 | 0.000032 | 0.000025 | 0.000474 | 0.000531 | 0.000467 |
| 2 | 3 | 0.000031 | 0.000033 | 0.000457 | 0.000521 | 0.000016 |
| 3 | 4 | 0.000033 | 0.000038 | 0.000539 | 0.000609 | 0.000105 |
| 4 | 5 | 0.000032 | 0.000045 | 0.000601 | 0.000678 | 0.000015 |
| 5 | 6 | 0.000035 | 0.000052 | 0.000748 | 0.000834 | 0.000128 |
| 6 | 7 | 0.000034 | 0.000061 | 0.001039 | 0.001135 | 0.000164 |
| 7 | 8 | 0.000036 | 0.000069 | 0.001753 | 0.001858 | 0.000160 |
| 8 | 9 | 0.000039 | 0.000080 | 0.002261 | 0.002380 | 0.000352 |
| 9 | 10 | 0.000045 | 0.000085 | 0.004054 | 0.004184 | 0.000285 |
| 10 | 11 | 0.000084 | 0.000114 | 0.011997 | 0.012195 | 0.000721 |
| 11 | 12 | 0.000091 | 0.000125 | 0.025298 | 0.025515 | 0.001000 |
LinearModel
We test initialization, encoding, and decoding for an input of .5 on each dimension up to the same 12-qubit practical documentation limit.
from qrobot.models import LinearModel

max_n = 12
table = list()

for n in range(1, max_n + 1):
    print(f"Testing n={n}", end="\r")
    table.append(test_model(LinearModel, n))
print("             ")


df_linear = pd.DataFrame(
    table, columns=["n", "Initialization", "Encode", "Decode", "Total", "Total STD"]
)
Testing n=1
Testing n=2
Testing n=3
Testing n=4
Testing n=5
Testing n=6
Testing n=7
Testing n=8
Testing n=9
Testing n=10
Testing n=11
Testing n=12
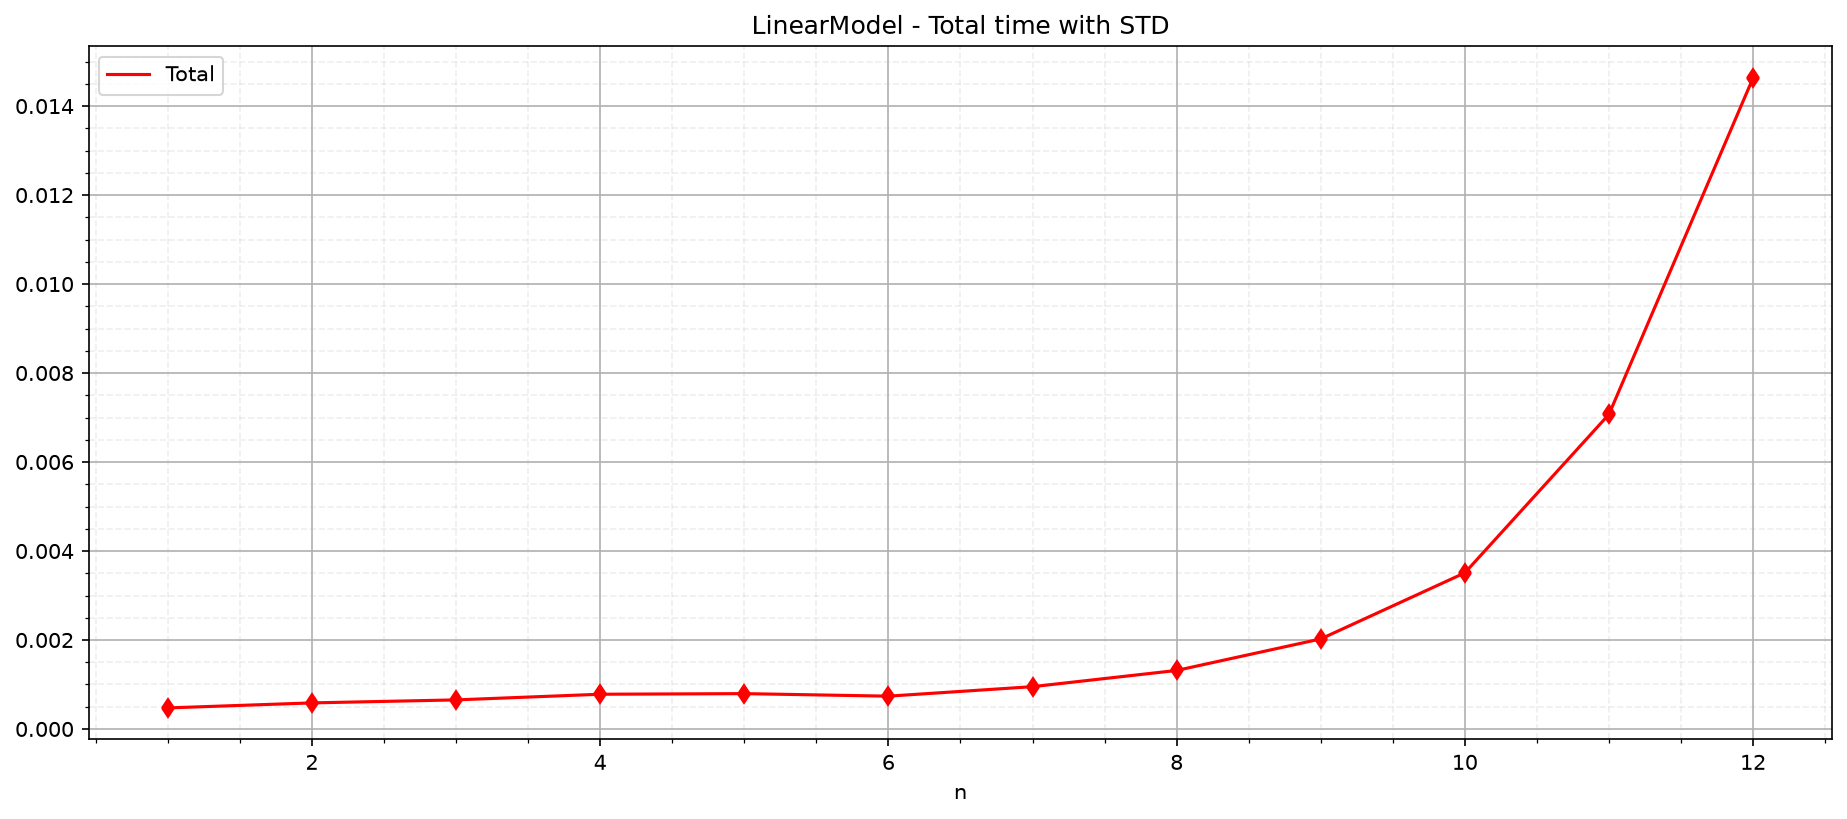
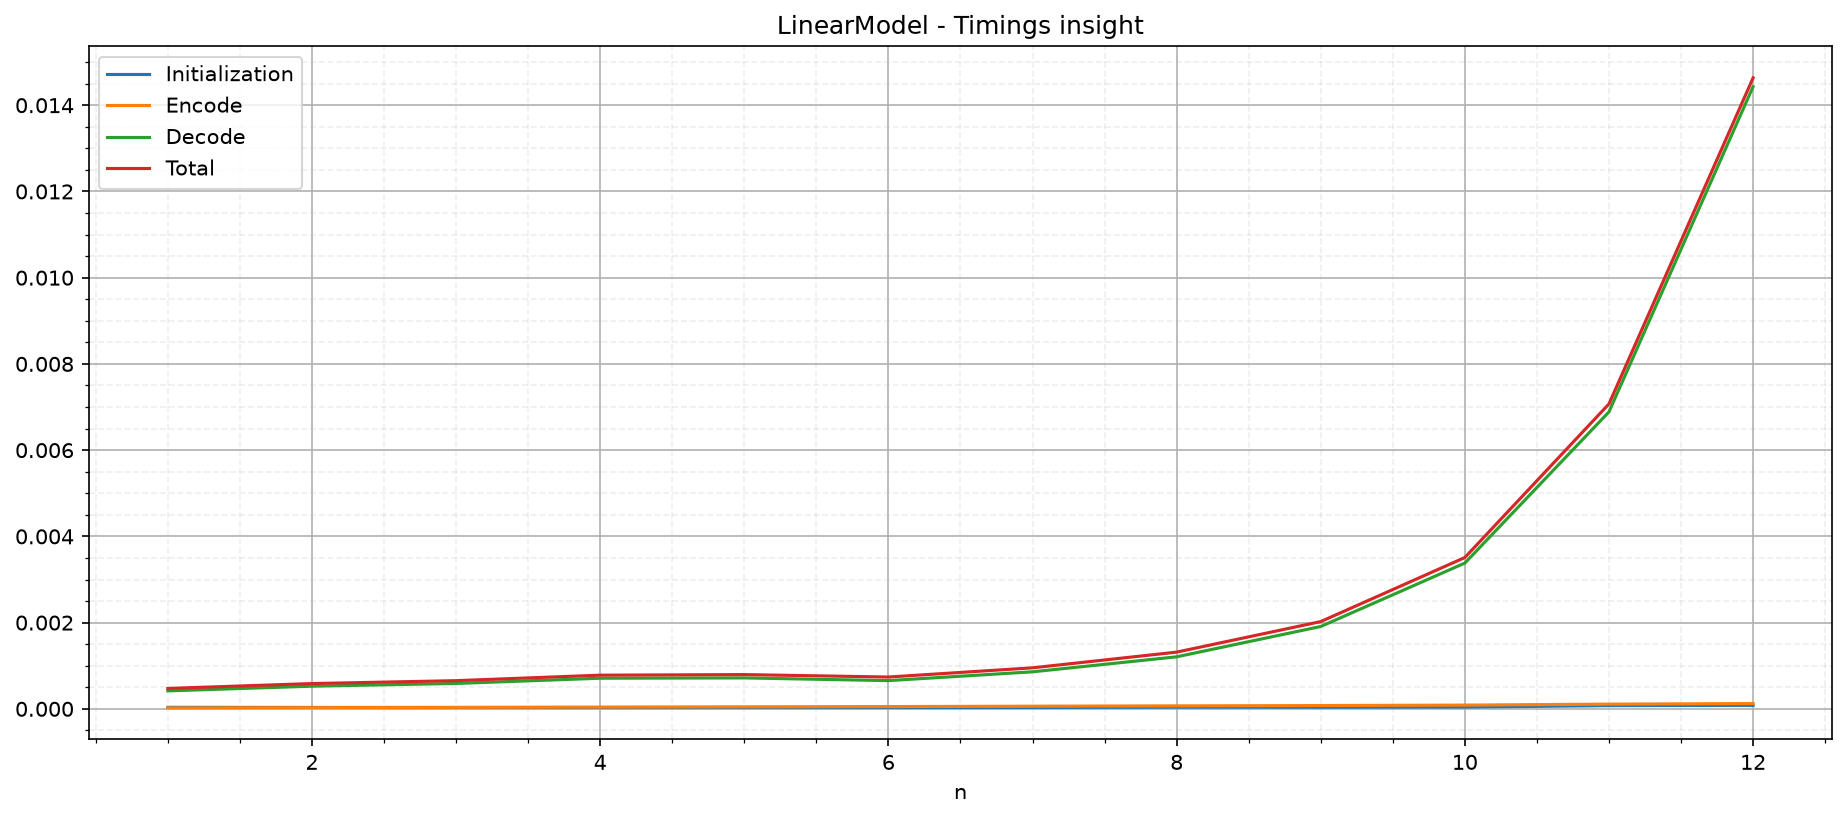
plot_results(df_linear, "LinearModel")
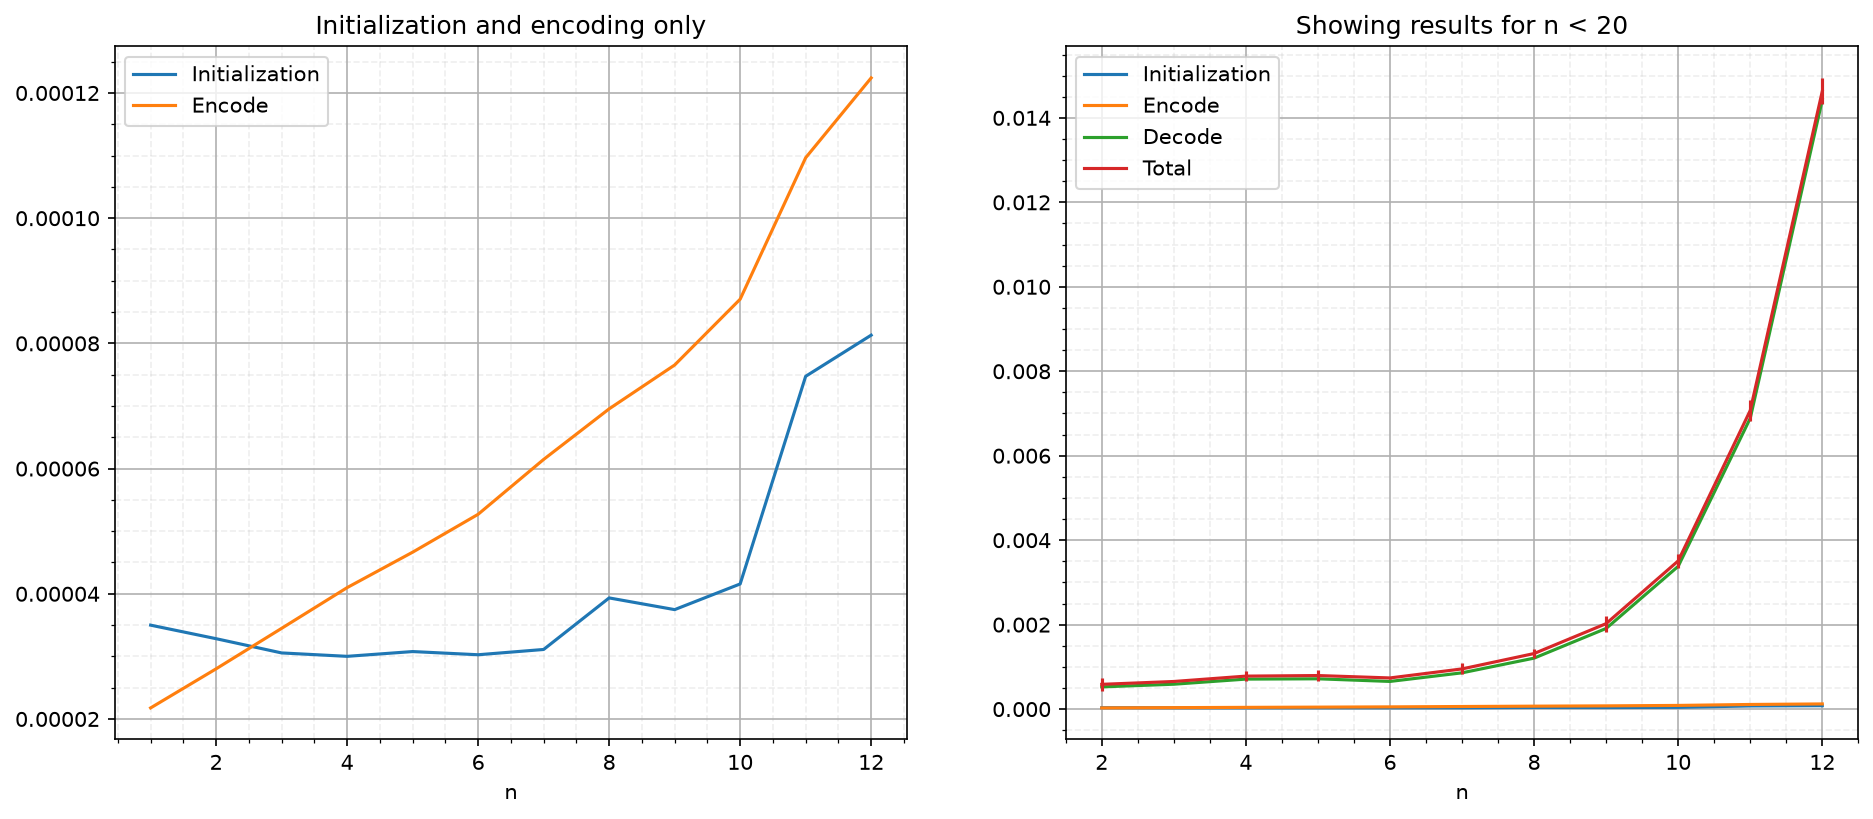
Zooming in:
df_linear
| n | Initialization | Encode | Decode | Total | Total STD | |
|---|---|---|---|---|---|---|
| 0 | 1 | 0.000035 | 0.000022 | 0.000417 | 0.000474 | 0.000146 |
| 1 | 2 | 0.000033 | 0.000028 | 0.000526 | 0.000586 | 0.000146 |
| 2 | 3 | 0.000031 | 0.000034 | 0.000589 | 0.000654 | 0.000016 |
| 3 | 4 | 0.000030 | 0.000041 | 0.000710 | 0.000781 | 0.000110 |
| 4 | 5 | 0.000031 | 0.000047 | 0.000717 | 0.000795 | 0.000141 |
| 5 | 6 | 0.000030 | 0.000053 | 0.000655 | 0.000738 | 0.000018 |
| 6 | 7 | 0.000031 | 0.000061 | 0.000859 | 0.000952 | 0.000130 |
| 7 | 8 | 0.000039 | 0.000070 | 0.001207 | 0.001316 | 0.000108 |
| 8 | 9 | 0.000037 | 0.000077 | 0.001910 | 0.002024 | 0.000192 |
| 9 | 10 | 0.000042 | 0.000087 | 0.003381 | 0.003510 | 0.000170 |
| 10 | 11 | 0.000075 | 0.000110 | 0.006887 | 0.007072 | 0.000248 |
| 11 | 12 | 0.000081 | 0.000122 | 0.014429 | 0.014633 | 0.000313 |
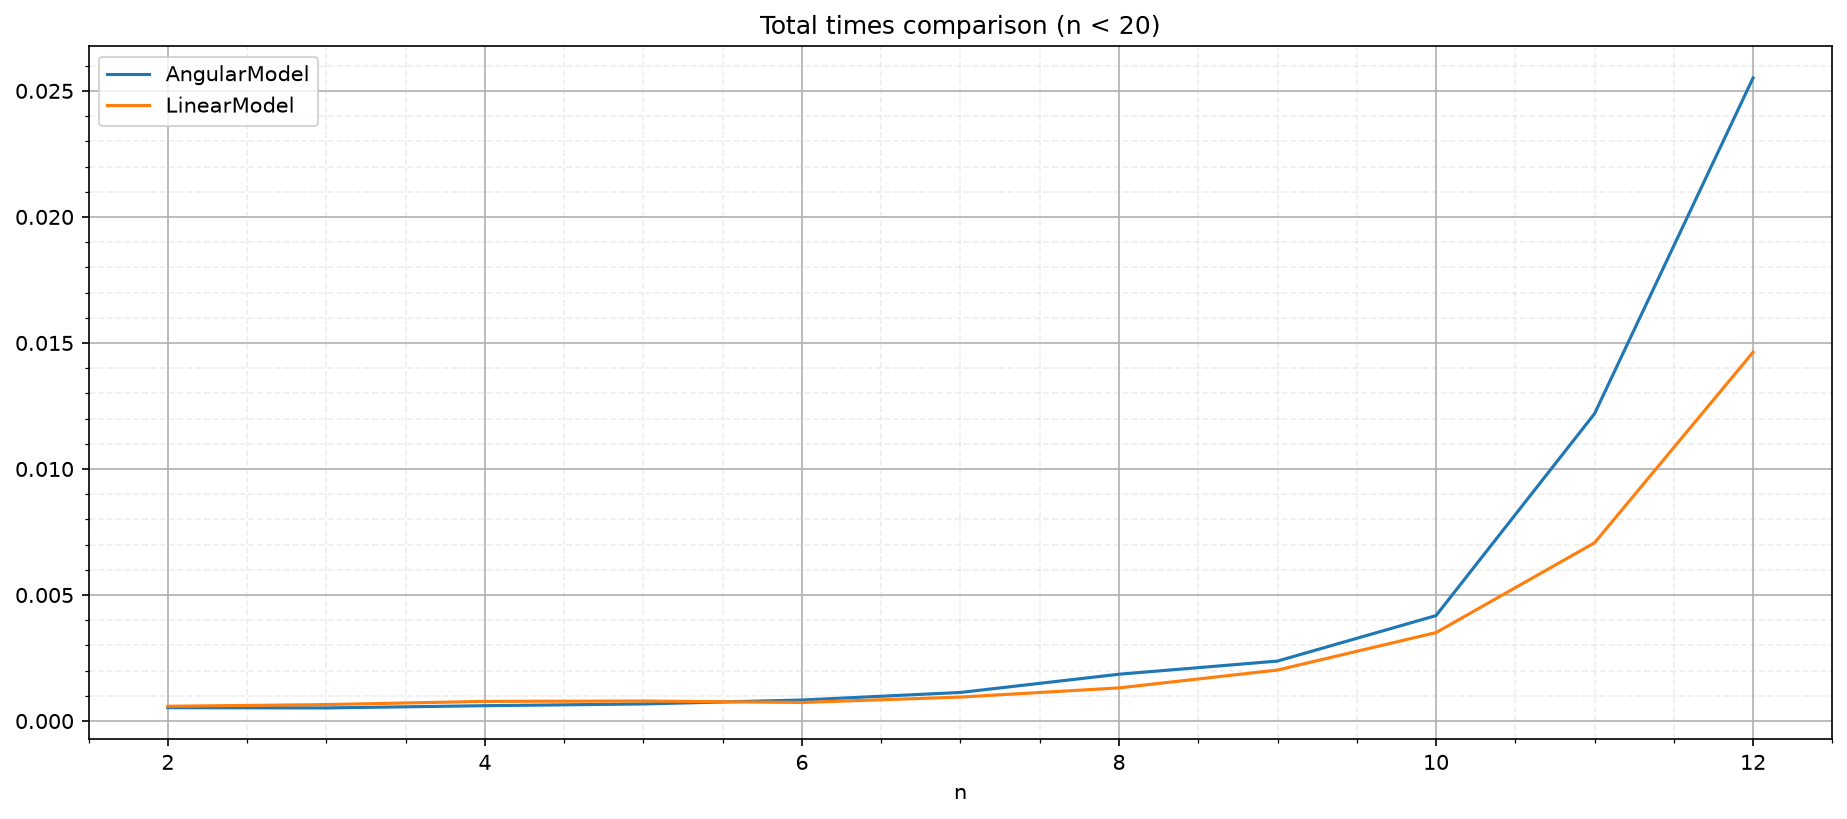
Comparison
fig = plt.figure(figsize=(15, 6), dpi=150)

df_angular.plot(x="n", y=[4], kind="line", ax=plt.gca())
df_linear.plot(x="n", y=[4], kind="line", ax=plt.gca())
plt.legend(["AngularModel", "LinearModel"])
plt.title("Total times comparison")

plt.grid(visible=True, which="major", linestyle="-")
plt.grid(visible=True, which="minor", linestyle="--", alpha=0.2)
plt.minorticks_on()

plt.show()
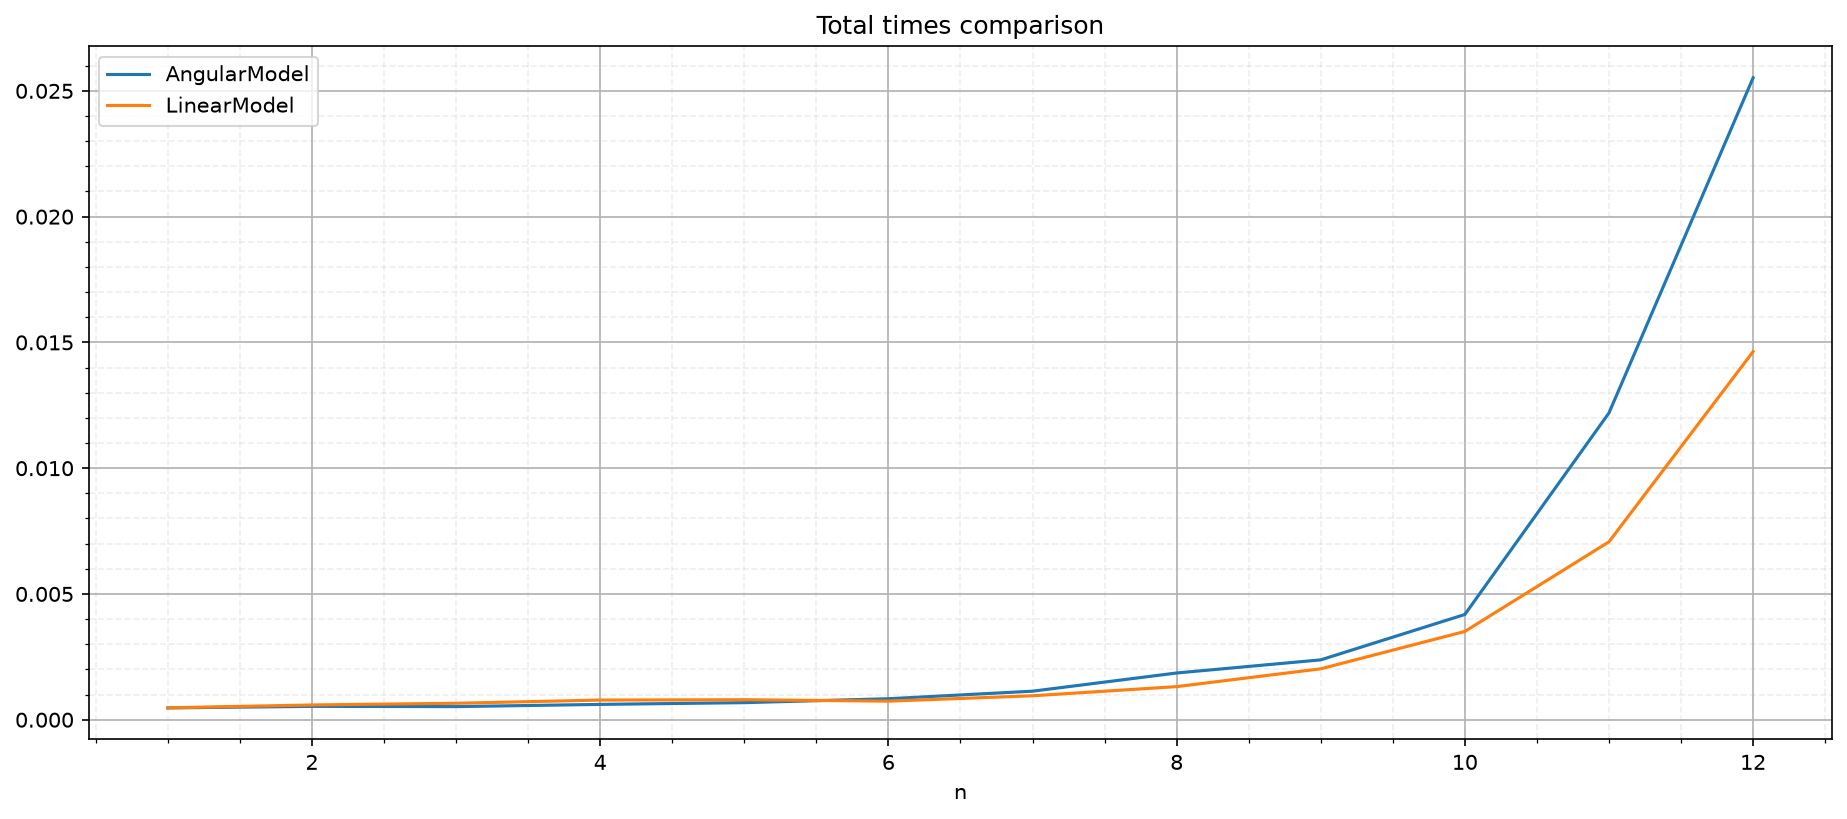
fig = plt.figure(figsize=(15, 6), dpi=150)

df_angular.plot(x="n", y=[5], kind="line", ax=plt.gca())
df_linear.plot(x="n", y=[5], kind="line", ax=plt.gca())

plt.legend(["AngularModel", "LinearModel"])
plt.title("Total times STD comparison")

plt.grid(visible=True, which="major", linestyle="-")
plt.grid(visible=True, which="minor", linestyle="--", alpha=0.2)
plt.minorticks_on()

plt.show()
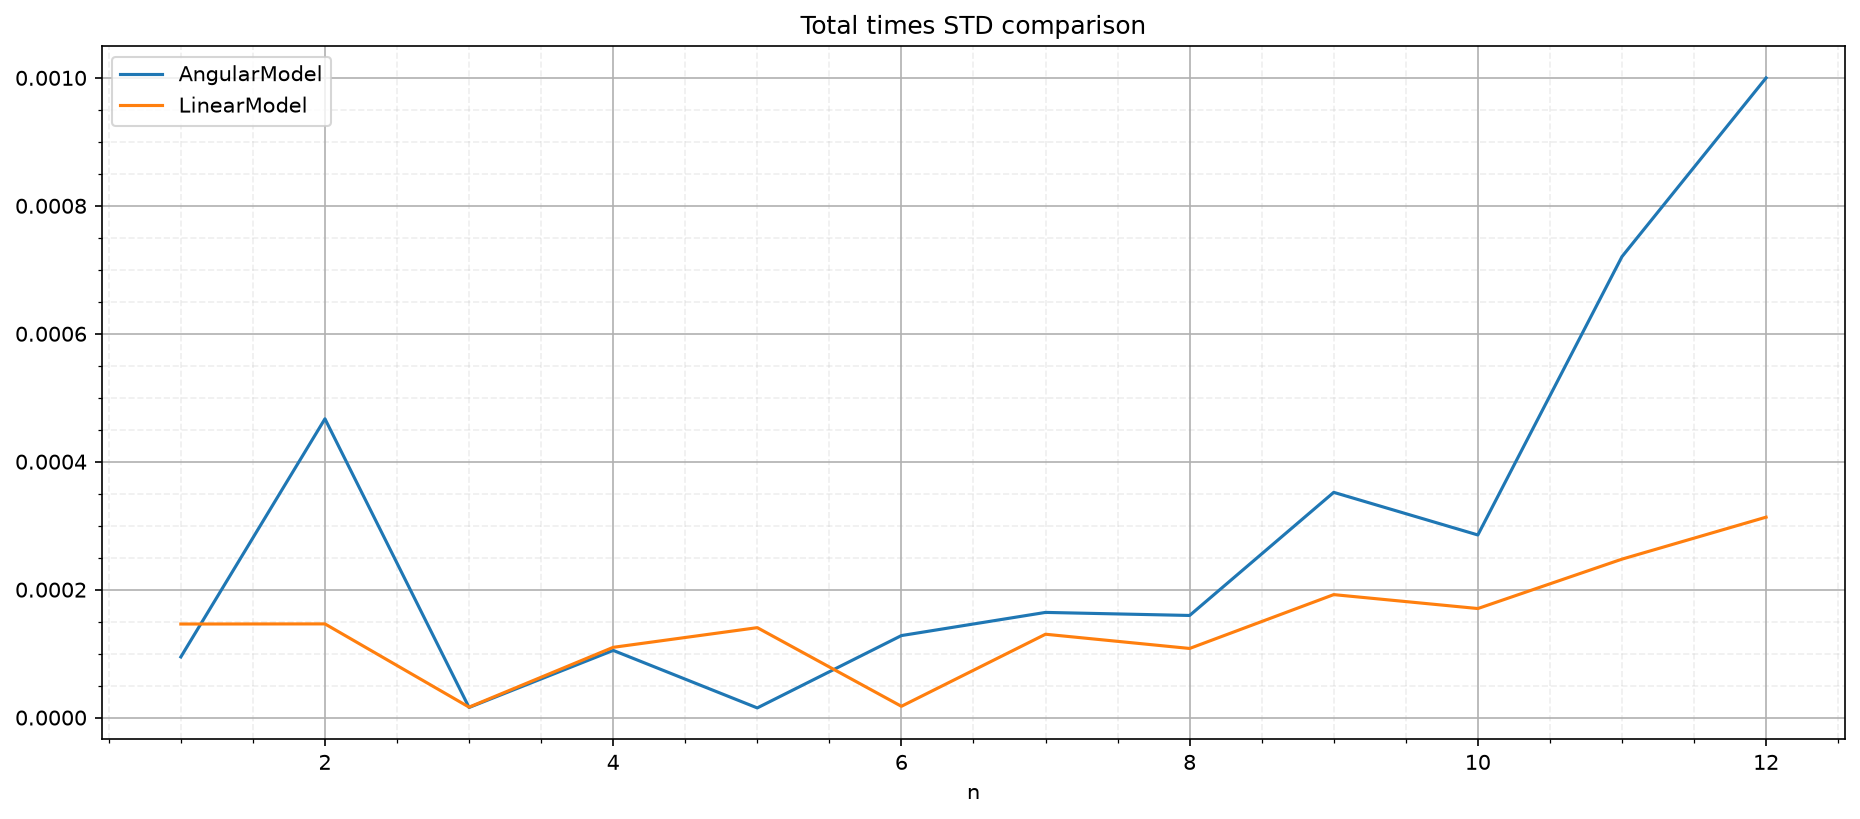
fig = plt.figure(figsize=(15, 6), dpi=150)

df_angular[1:19].plot(x="n", y=[4], kind="line", ax=plt.gca())
df_linear[1:19].plot(x="n", y=[4], kind="line", ax=plt.gca())

plt.legend(["AngularModel", "LinearModel"])
plt.title("Total times comparison (n < 20)")

plt.grid(visible=True, which="major", linestyle="-")
plt.grid(visible=True, which="minor", linestyle="--", alpha=0.2)
plt.minorticks_on()

plt.show()